监控你的自动化
Automations 标签页是 Agent Control Plane 的只读运维视图。它把两个指标卡、一个交互式 sankey,以及两个可搜索、筛选和排序的子表 - Automations 和 Consumption - 放在一起。
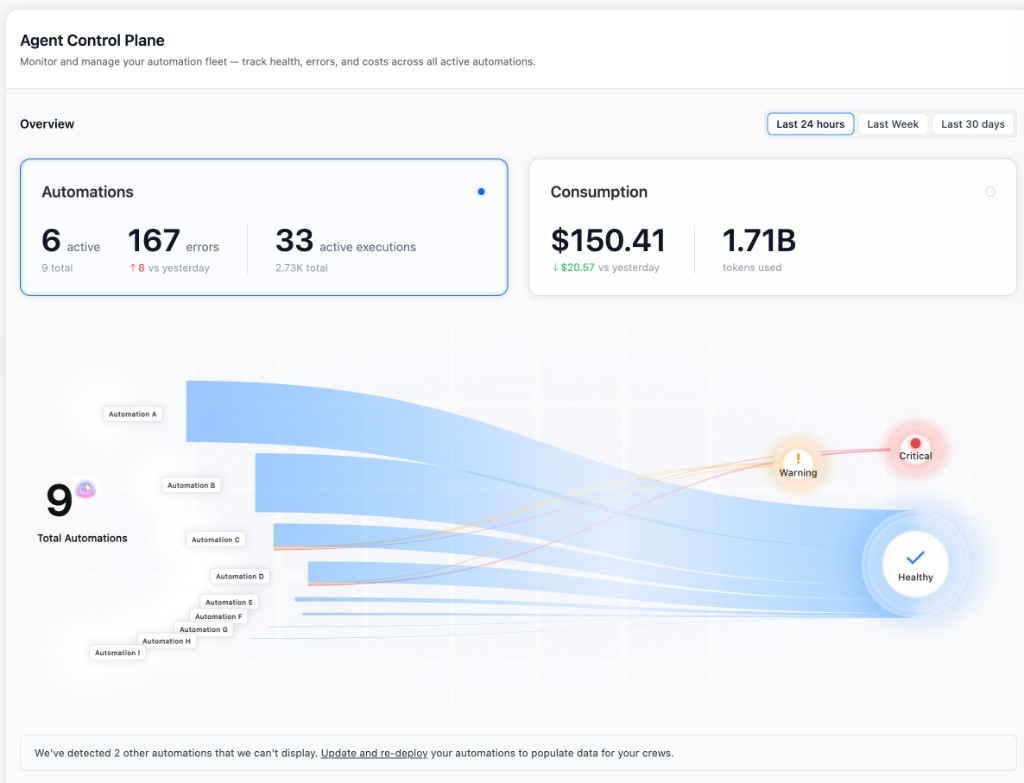
右上角的 Last 24 hours / Last Week / Last 30 days 选择器会作用于所有图表和表格。差值会将当前所选时间窗与同长度的前一时间窗进行比较。
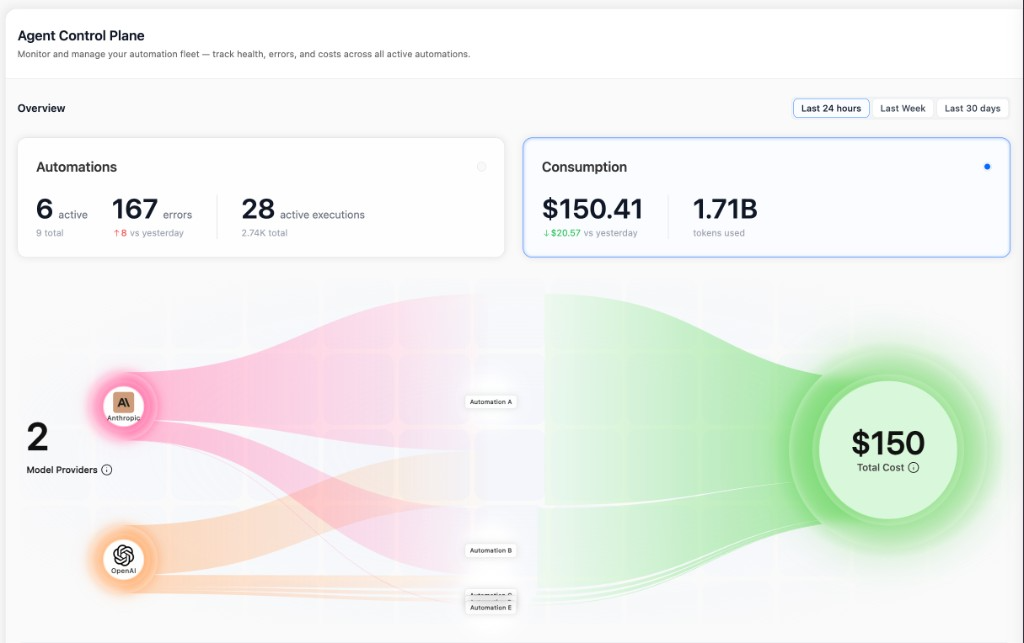
页面顶部有两个指标卡和一个交互式 sankey。点击任一卡片都会在两种模式之间切换 sankey:
- Health mode -
Total Automations → status buckets (Critical / Warning / Healthy)。点击某个分组即可把 Automations 表格过滤为仅显示这些部署。 - Consumption mode -
Model Providers → Automations → Total Cost。点击某个 provider 即可将 Consumption 表格过滤到该 provider。
| 卡片 | 显示内容 |
|---|---|
| Automations | active 自动化(以及总数)、时间窗内的 errors 总数、当前 active executions(以及时间窗内总数),并显示与上一周期的差值。 |
| Consumption | cost 总额和 tokens used,并显示与上一周期的成本差值。 |
Automations 表格
Section titled “Automations 表格”Automations 子标签页会按部署拆分机群健康状态。每一行代表一个已部署的 crew 或 flow。
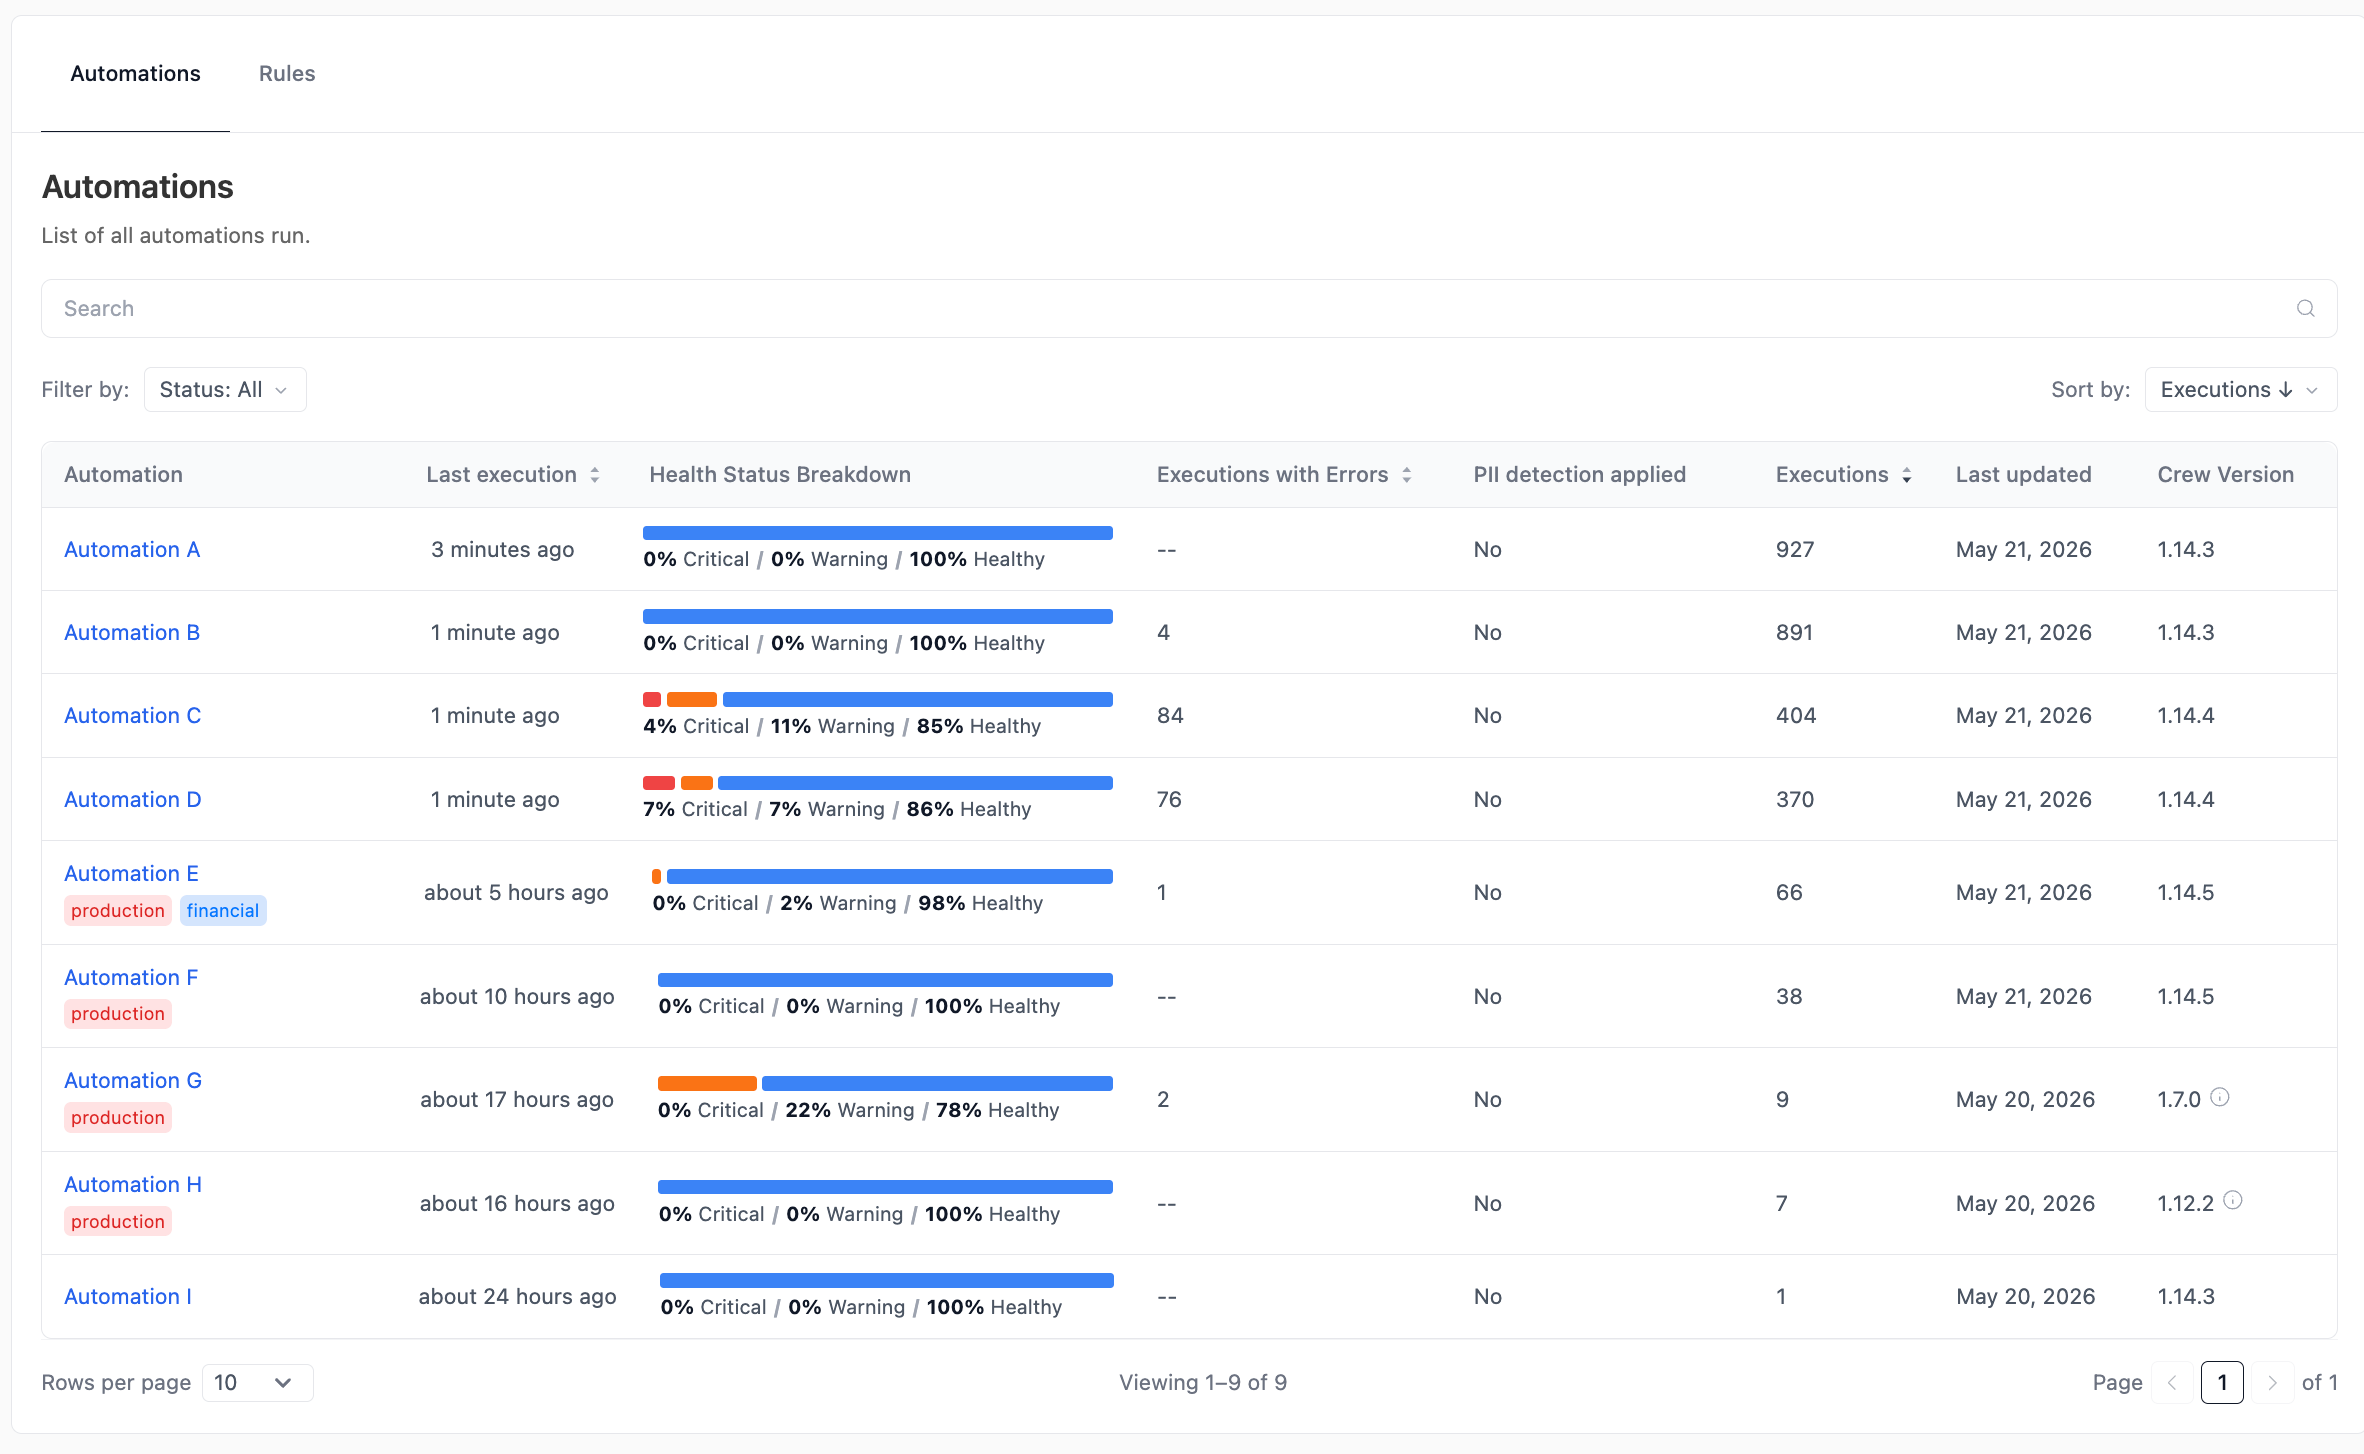
| 列 | 显示内容 |
|---|---|
| Automation | 部署名称及其分配的标签(例如 production、financial)。 |
| Last execution | 距离最近一次运行的时间。 |
| Health Status Breakdown | 时间窗内执行结果的 Critical / Warning / Healthy 百分比分布条。 |
| Executions with Errors | 时间窗内失败执行的总数。 |
| PII detection applied | 如果启用了按部署 PII 配置或匹配的 PII rule,则显示 Yes。 |
| Executions | 时间窗内执行总数。 |
| Last updated | 该部署最近一次重新部署的时间。 |
| Crew Version | 该部署报告的 crewai 版本。低于 1.13 的版本旁会有信息图标,提示这些行不能贡献指标。 |
可按名称搜索,按 Status(Healthy / Warning / Critical)筛选,并按任意列标题排序。点击部署名称可打开 Automation panel(见下文)。
Consumption 表格
Section titled “Consumption 表格”Consumption 子标签页会按部署拆分 LLM 支出和 token 使用情况。
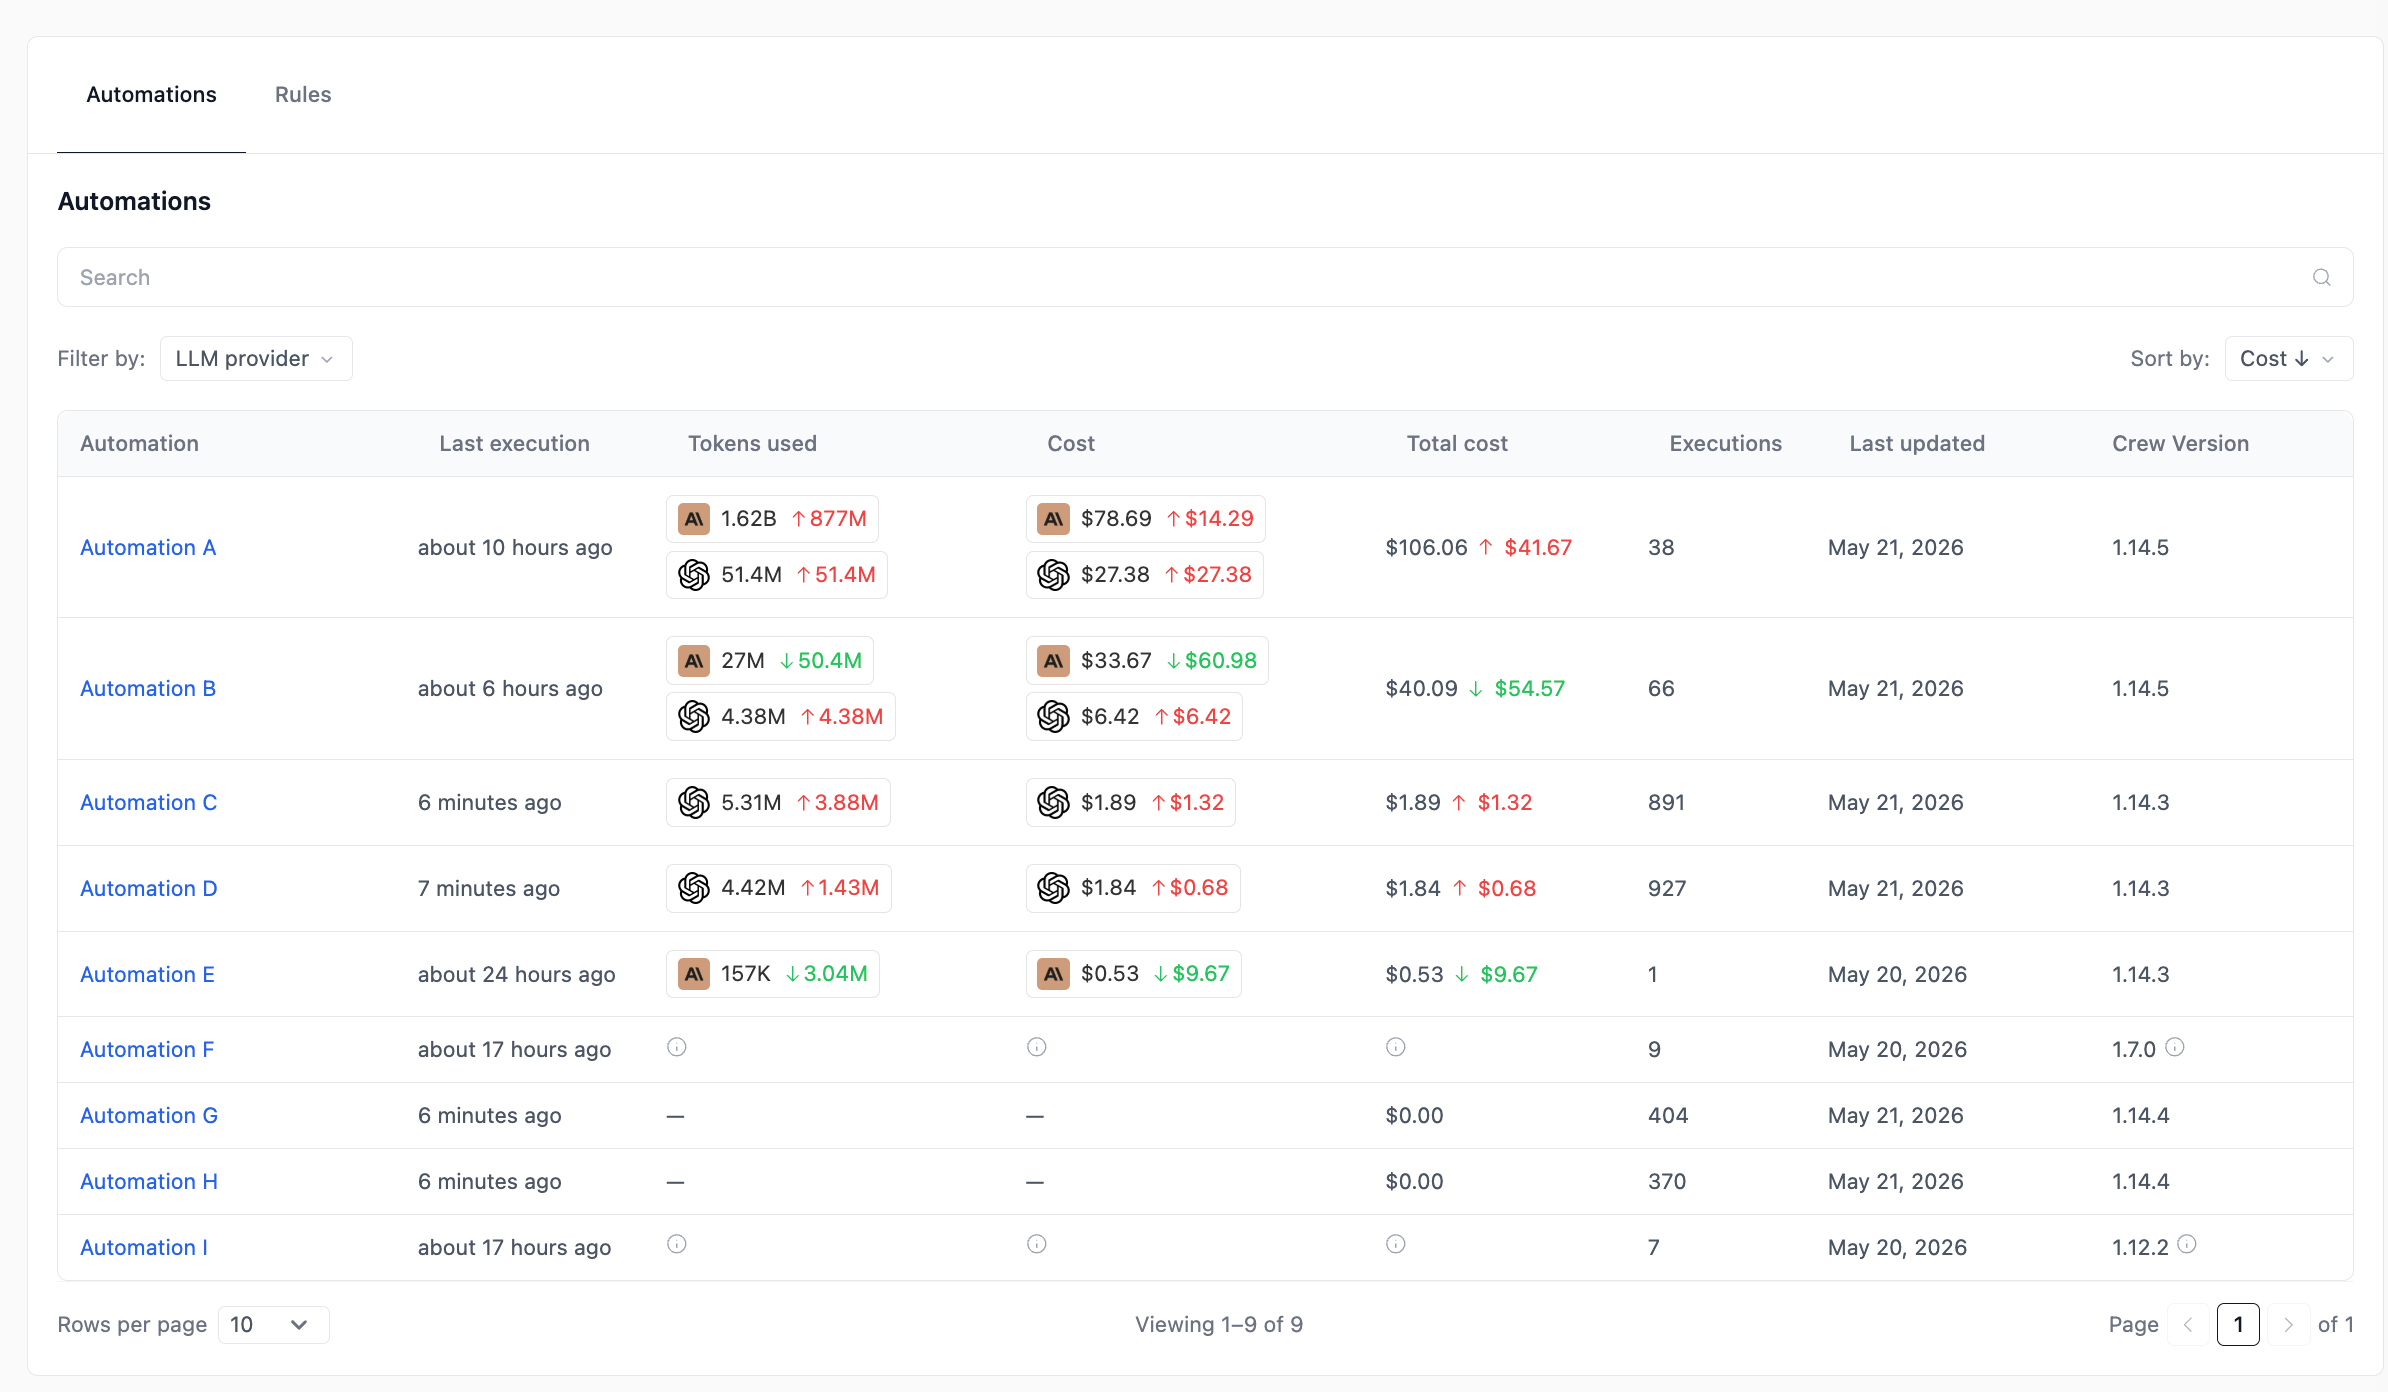
| 列 | 显示内容 |
|---|---|
| Automation | 部署名称。 |
| Last execution | 距离最近一次运行的时间。 |
| Tokens used | 每个被此自动化使用的 LLM provider 各占一行,并显示与上一周期的差值。 |
| Cost | 每个 LLM provider 的成本,并显示与上一周期的差值。 |
| Total cost | 所有 provider 的合计,并显示差值。 |
| Executions | 时间窗内的执行总数。 |
| Last updated | 该部署最近一次重新部署的时间。 |
| Crew Version | 该部署报告的 crewai 版本。 |
可按 LLM provider 筛选,并按 Cost、Executions 或 Last run 排序。
Agent Control Plane - 概览
ACP 是什么、要求、套餐层级和 RBAC。
Agent Control Plane - 规则
在多个自动化上应用组织级 PII Redaction 规则。
Traces
钻取单次执行,查看 agent 推理、工具调用和 token 使用情况。
Deploy to AMP
在支持 Agent Control Plane 的 crewAI 版本上部署一个 crew。
需要帮助?
联系我们的支持团队,获取关于 Agent Control Plane 指标解读的帮助。