OpenTelemetry Export
CrewAI AMP can export OpenTelemetry traces and logs from your deployments directly to your own collector. This lets you monitor agent performance, track LLM calls, and debug issues using your existing observability stack.
Telemetry data follows the OpenTelemetry GenAI semantic conventions plus additional CrewAI-specific attributes.
Prerequisites
Section titled “Prerequisites”CrewAI AMP account
Your organization must have an active CrewAI AMP account.
OpenTelemetry collector
You need an OpenTelemetry-compatible collector endpoint (e.g., your own OTel Collector, Datadog, Grafana, or any OTLP-compatible backend).
Setting up a collector
Section titled “Setting up a collector”- In CrewAI AMP, go to Settings > OpenTelemetry Collectors.
- Click Add Collector.
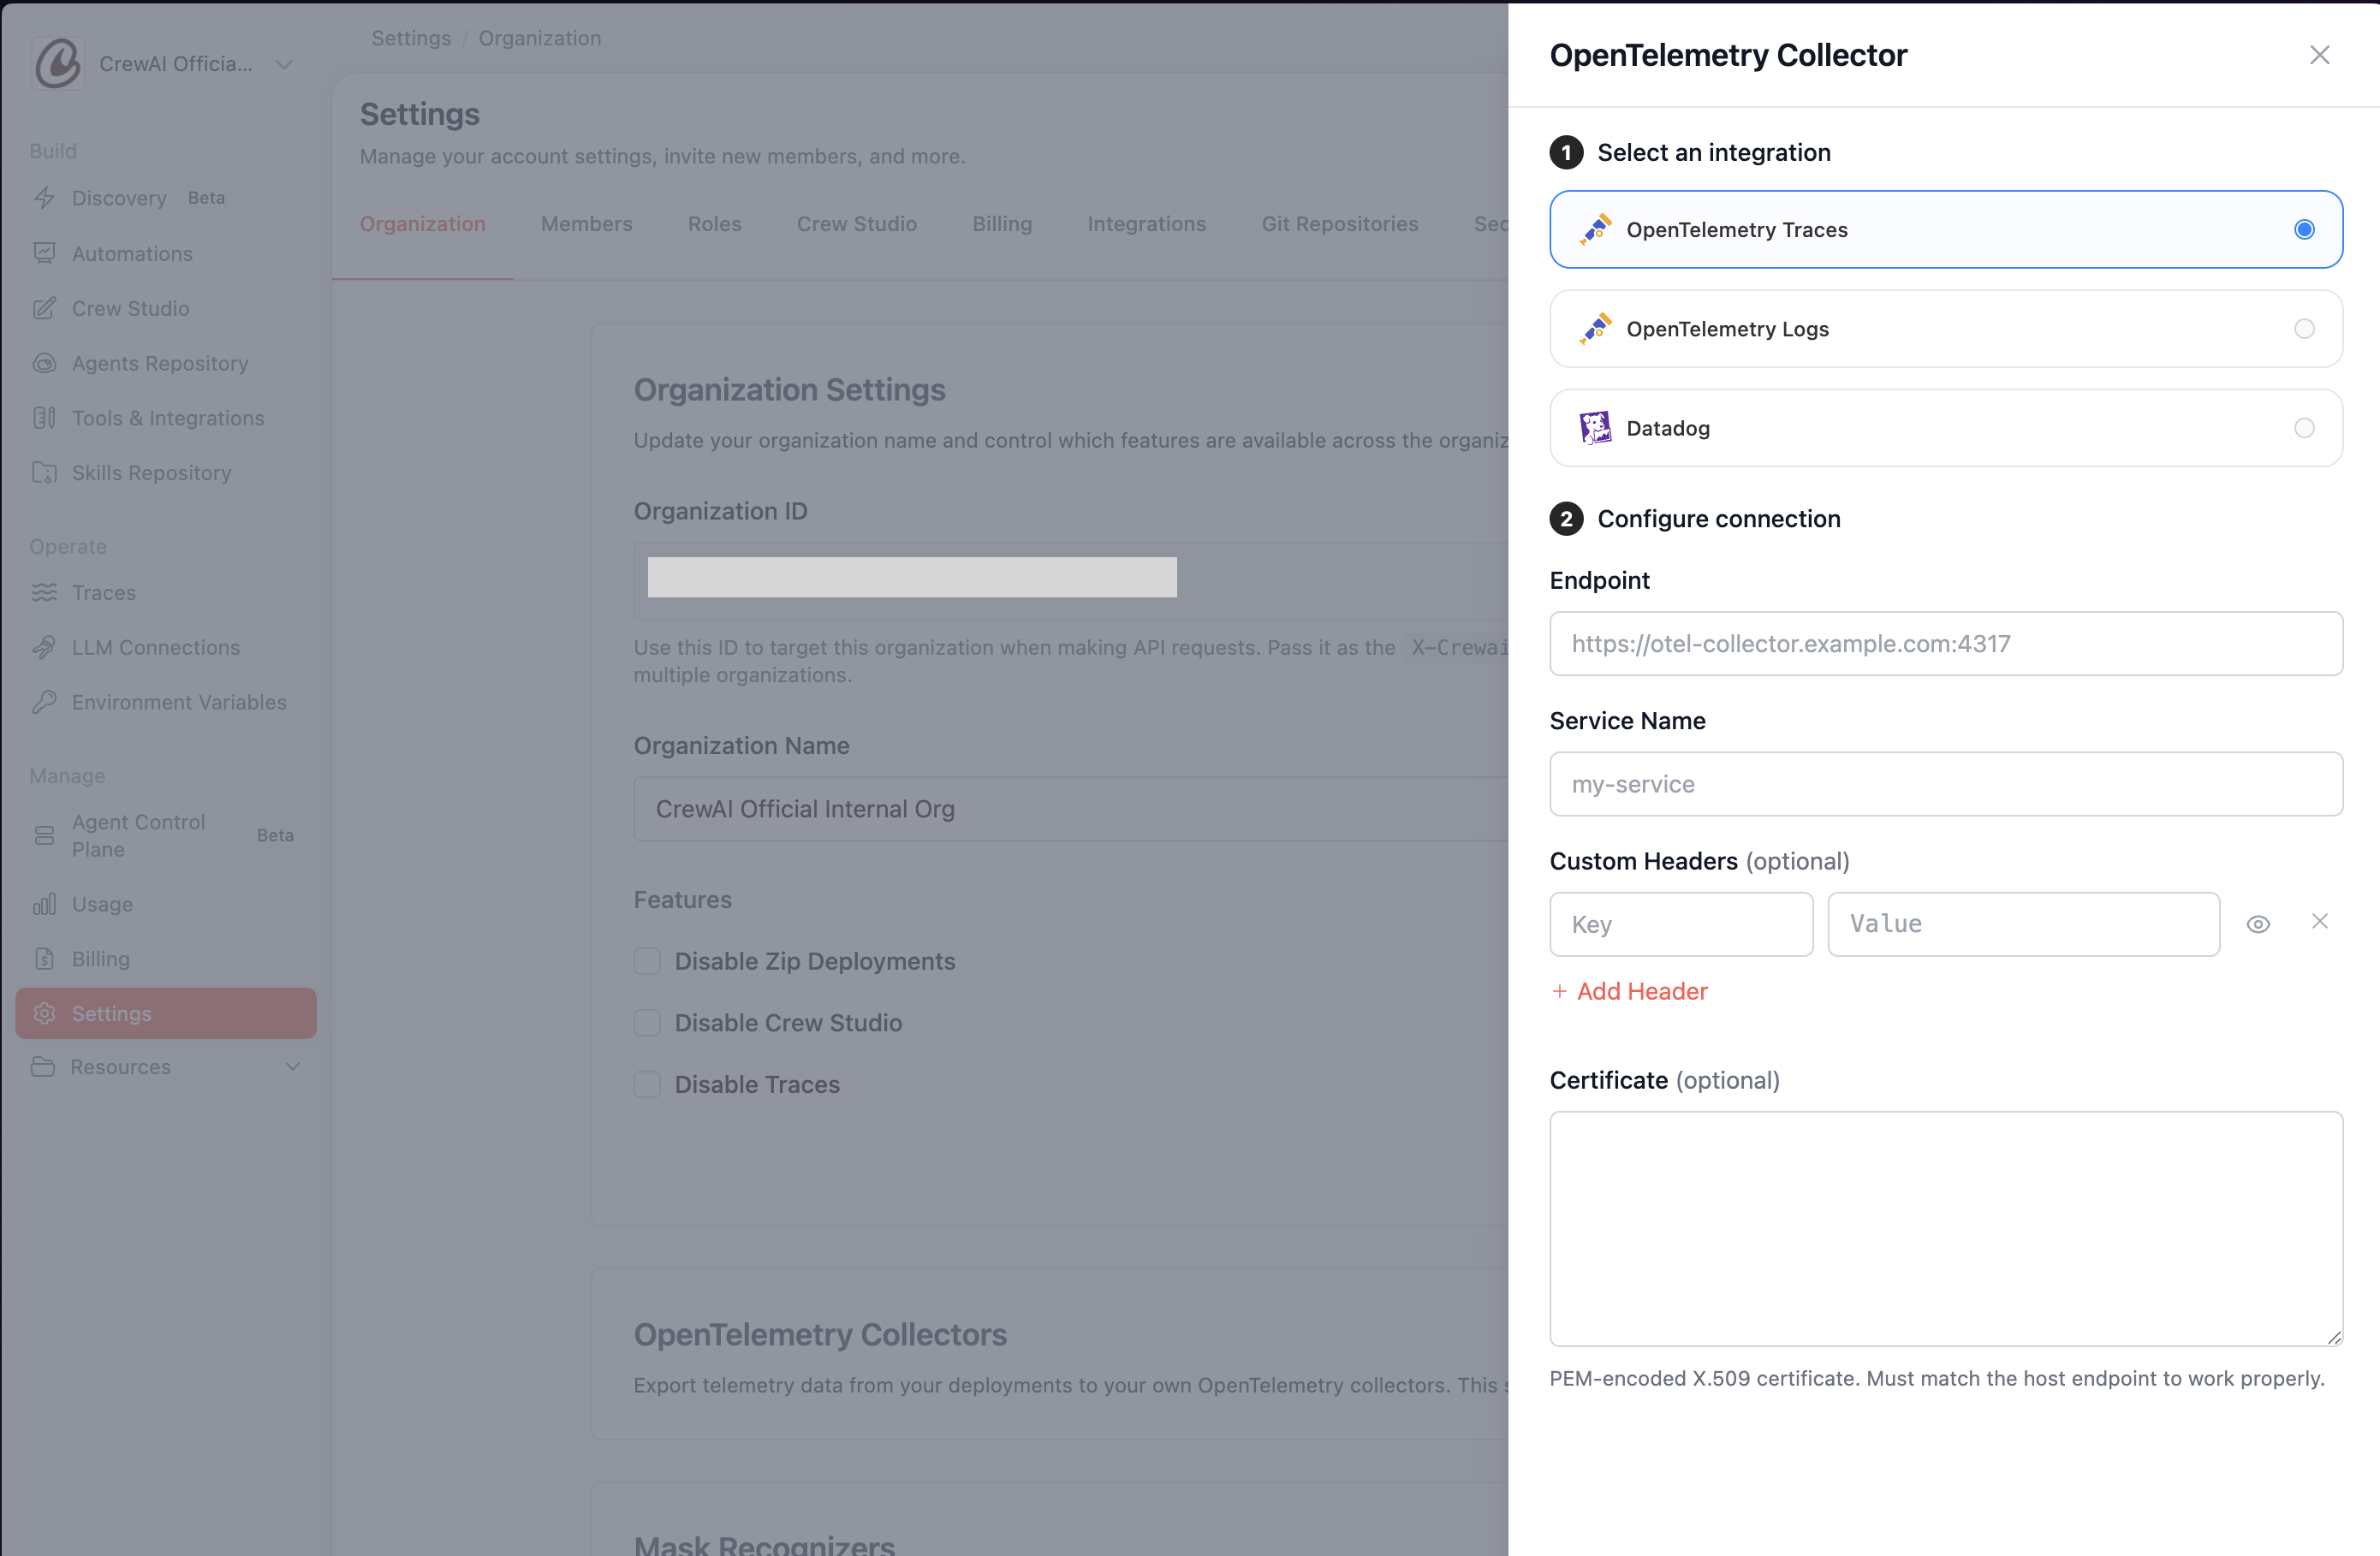
- Select an integration:
- OpenTelemetry Traces and OpenTelemetry Logs — export to any OTLP-compatible collector or backend.
- Datadog — send traces straight to Datadog’s OTLP intake, no separate collector or Datadog Agent required.
- Configure the connection. The fields depend on the integration you selected:
OpenTelemetry Traces and OpenTelemetry Logs are separate integrations that share the same fields — pick the one matching the signal you want to export.
- Endpoint — Your collector’s OTLP endpoint (e.g.,
https://otel-collector.example.com:4317). - Service Name — A name to identify this service in your observability platform.
- Custom Headers (optional) — Add authentication or routing headers as key-value pairs.
- Certificate (optional) — Provide a TLS certificate if your collector requires one.
For Datadog setup, see the dedicated Datadog Integration guide — it covers both the Datadog Agent path (recommended, cheaper for log volume) and Datadog’s OTLP intake with full collector configuration steps.
- (optional) Click Test Connection to verify CrewAI can reach the endpoint with the credentials you provided.
- Click Save.